Tutorial 2: Creating a chemical potential diagram for any system (fixed temperature)
Table of Contents
This tutorial is for Chesta version 3.4.3.
Introduction
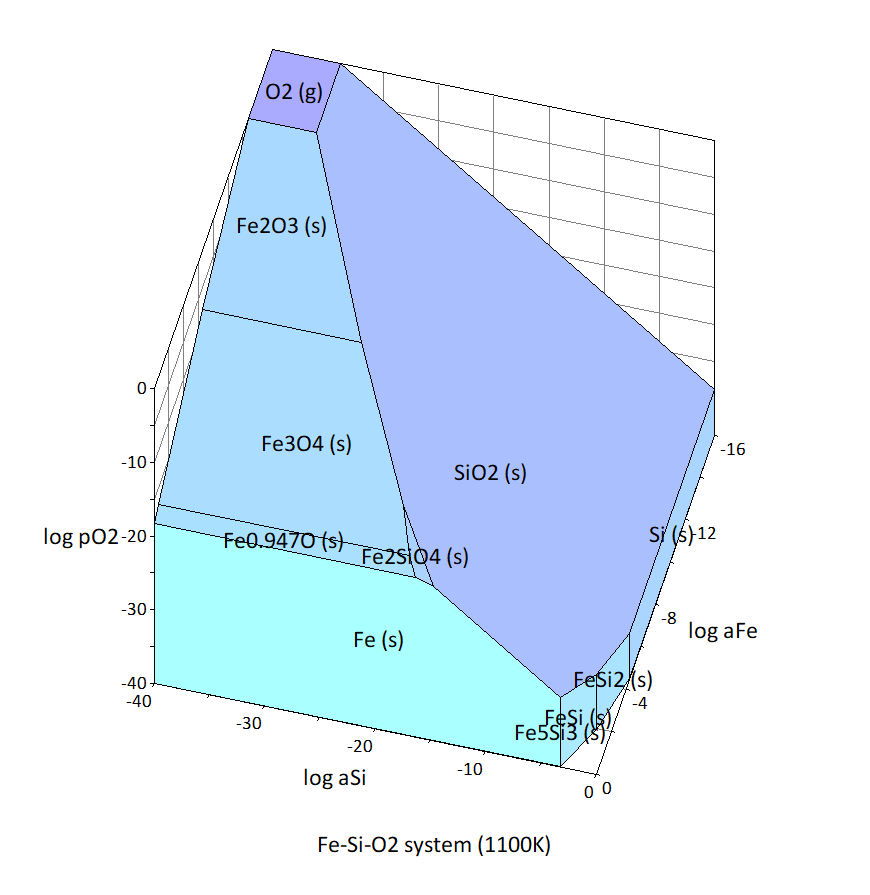
In this article, I will explain the process of creating a chemical potential diagram for the Fe-Si-O system at 1100 K as an example.
Collect thermodynamic data
First, collect thermodynamic data (standard Gibbs energy of formation) for substances in the Fe-Si-O system from thermodynamic data collections and literature. Table 1 shows the data I collected.
Table 1 Standard Gibbs energies of formation of substances in the Fe-Si-O system (1100 K)
| Substance | ΔfG° (kJ mol-1) | source |
| Fe (s) | 0 | |
| Si (s) | 0 | |
| O2 (g) | 0 | |
| Fe0.947O (s) | -192.927 | [1] |
| Fe2O3 (s) | -537.171 | [1] |
| Fe3O4 (s) | -762.463 | [1] |
| SiO2 (s, quartz) | -712.805 | [1] |
| Fe2SiO4 (s) | -1115.31 | [2] |
| FeSiO3 (s) | -913.464 | [2] |
| Fe5Si3 (s) | -204.794 | Calculated from [2][3] |
| FeSi (s) | -68.11 | Calculated from [2][3] |
| FeSi2 (s) | -94.839 | Calculated from [2][3] |
[1] M.W. Chase Jr., NIST-JANAF Thermochemical Tables, fourth ed., J. Phys. Chem. Ref. Data, Monograph No. 9, 1998.
[2] I. Barin, Thermochemical Data of Pure Substances, VCH Verlagsgesellschaft mbH (1993).
[3] S. Cui, I.-H. Jung, CALPHAD: Comput. Coupling Phase Diagrams Thermochem., 50 (2017) 108–125.
Create a data file
Use the collected thermodynamic data to create a data file for Chesta. Chesta data files are in CSV format and can be edited in Microsoft Excel or a text editor. We will use Excel.
1. Decide the coordinate axes to be used in the chemical potential diagram. In this example, the independent components of the Fe-Si-O system are considered to be Fe, Si, and O2, as shown in Table 2, and the coordinate axes are log aFe , log aSi , and log(pO2 /bar), which represent their chemical potentials. aFe and aSi are the activities of Fe and Si, respectively, and pO2 is the partial pressure of O2. The standard state of each independent component is the state of pure Fe (s), Si (s), and O2 (g) at a pressure of 1 bar.
Table 2 Coordinate axes used
| Independent components of the system (standard substances) | Coordinate Axes |
| Fe | log aFe |
| S | log aSi |
| O2 | log(pO2 /bar) |
2. Open the "Data File Creation Wizard 3.xls" included with Chesta in Excel and enable macros.

3. Select your language.

4. Click the "Create a new data file" button, select "Normal chemical potential diagram (log activity axis)" in the window that appears, and click "Next." This selection will be reflected in the initial contents of the next detailed setting screen.

5. Enter the coordinate axis settings determined in step 1, and click "OK."

6. A new Excel sheet will open. Add information about each substance to the end of the sheet, one row per substance. (In the figure below, the blue text is the information added.) For example, row 54 in the figure below is information about Fe2SiO4. First, starting from the leftmost cell, enter "Phase" in column A and the substance name in column B. In columns C to E, enter the coefficients in the reaction equation in which 1 mol of each substance is produced from the independent components Fe, Si, and O2 of the system. The reaction equation for the production of Fe2SiO4 (s) is
2 Fe + Si + 2 O2 = Fe2SiO4,
so columns C to E in row 54 are 2, 1, and 2, respectively. Then, in column F, enter the standard Gibbs energy change of the production reaction in kJ/mol, and in column G, enter the activity shift (usually 0).

7. Save the Excel worksheet in CSV format and close Excel. When saving, a confirmation screen will appear saying "If you save as CSV (comma separated values), some of the workbook's features may be lost." but just save it.
Create chemical potential diagrams using Chesta
Following the same procedure as in the previous article , open the data file in Chesta and create a chemical potential diagram for the Fe-Si-O system.

